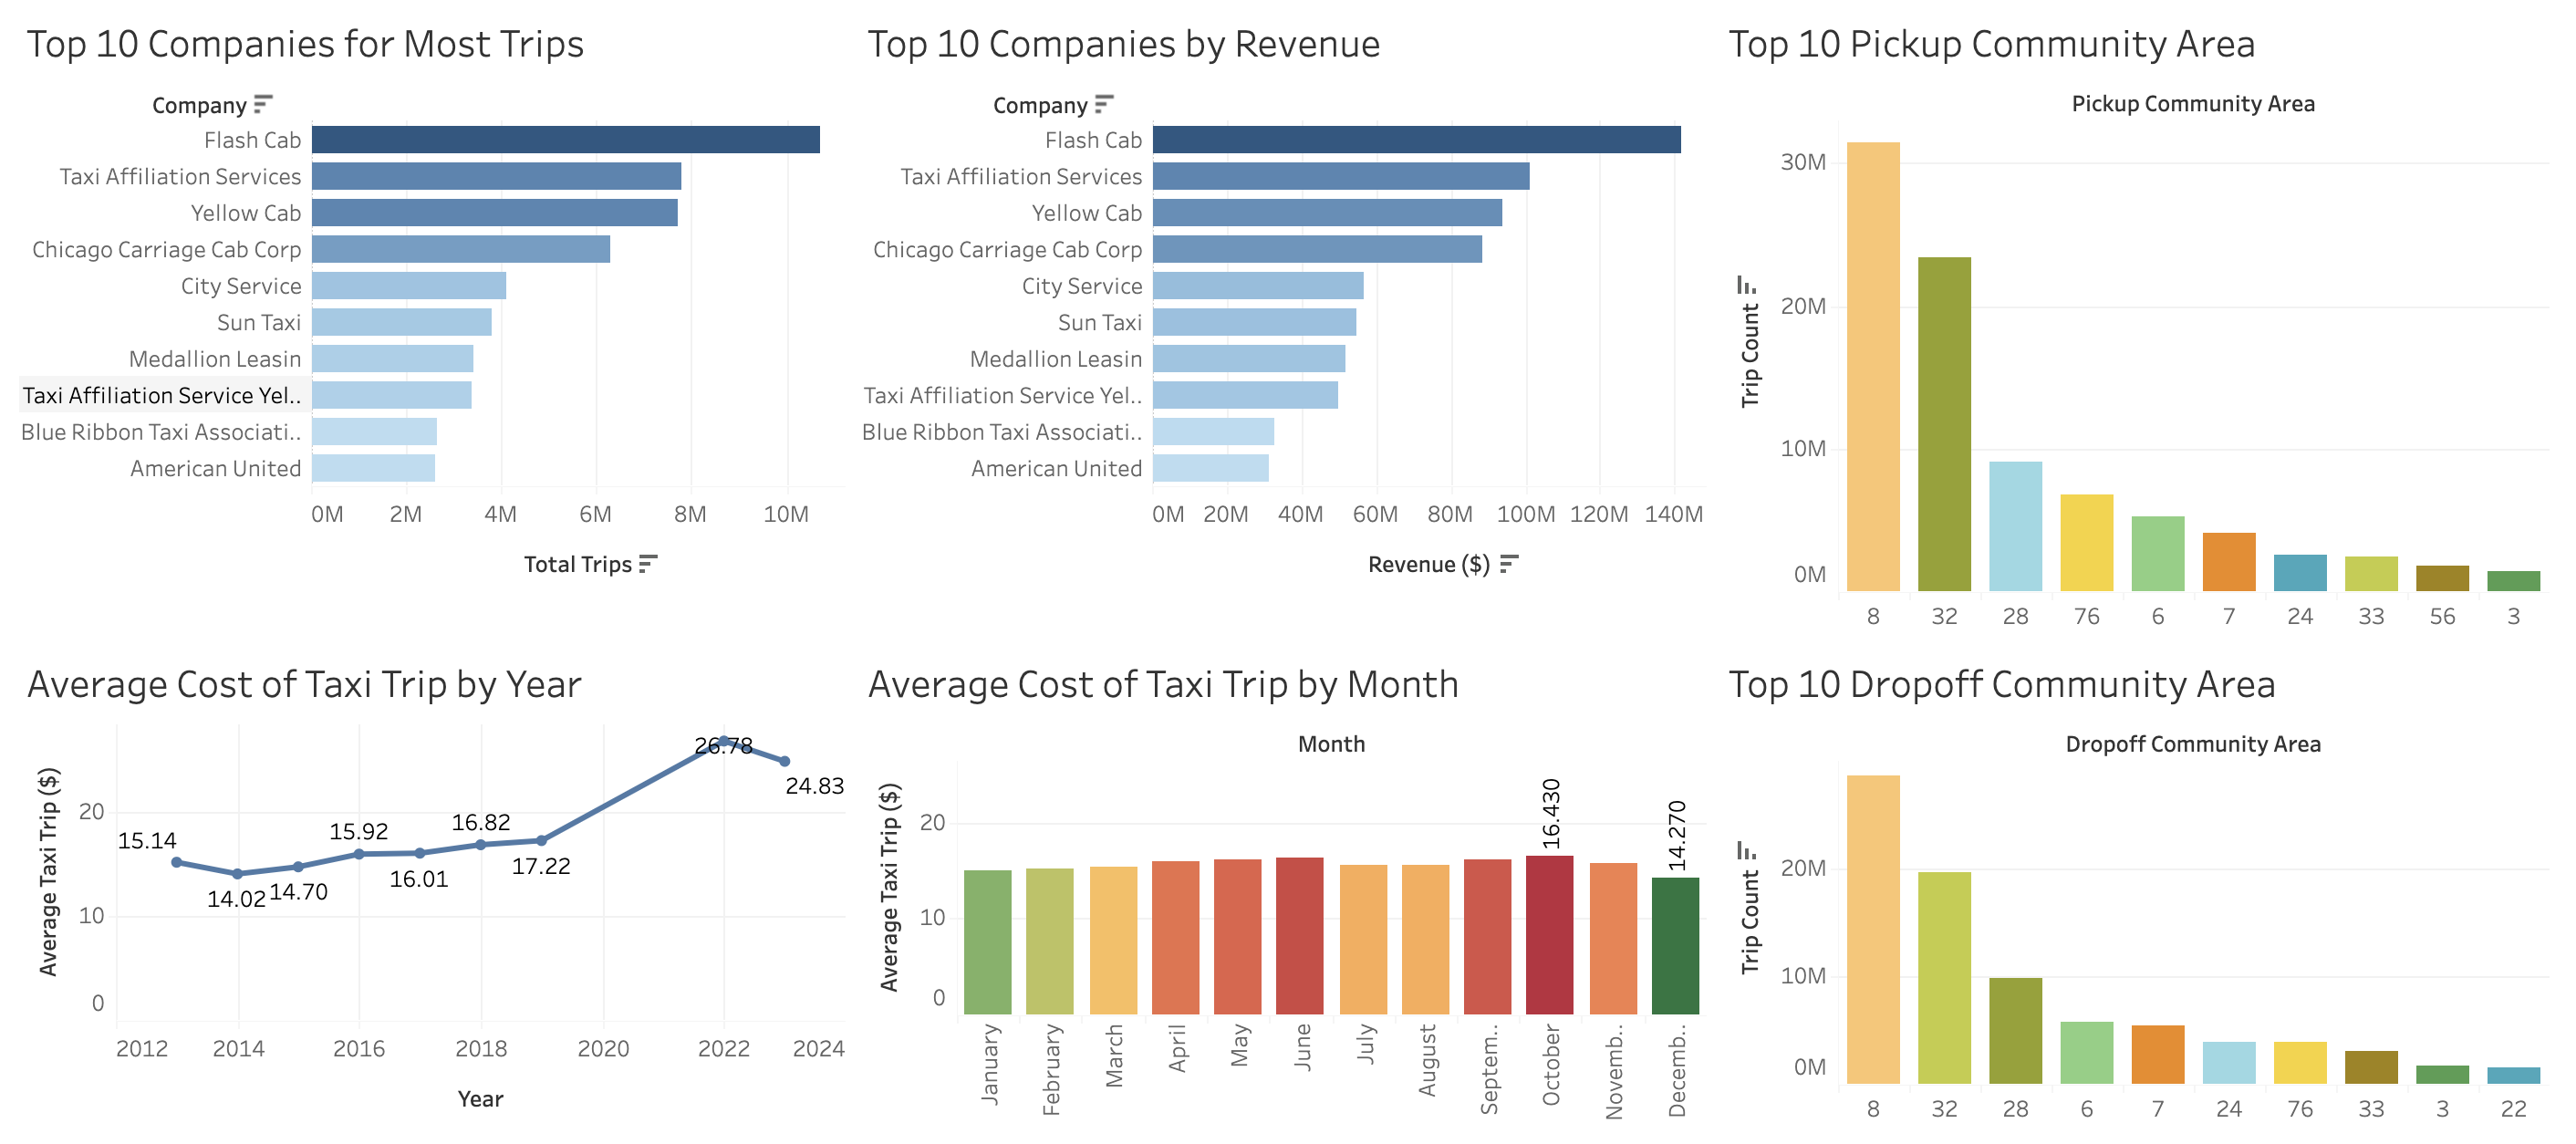
Utilised BigQuery to aggregate, transform, and
filter over 100 million rows of data from Chicago Taxi Trip public
dataset. Created a visualization dashboard with
Tableau to identify key business intelligences
and showcased the analysis on Google Slides.
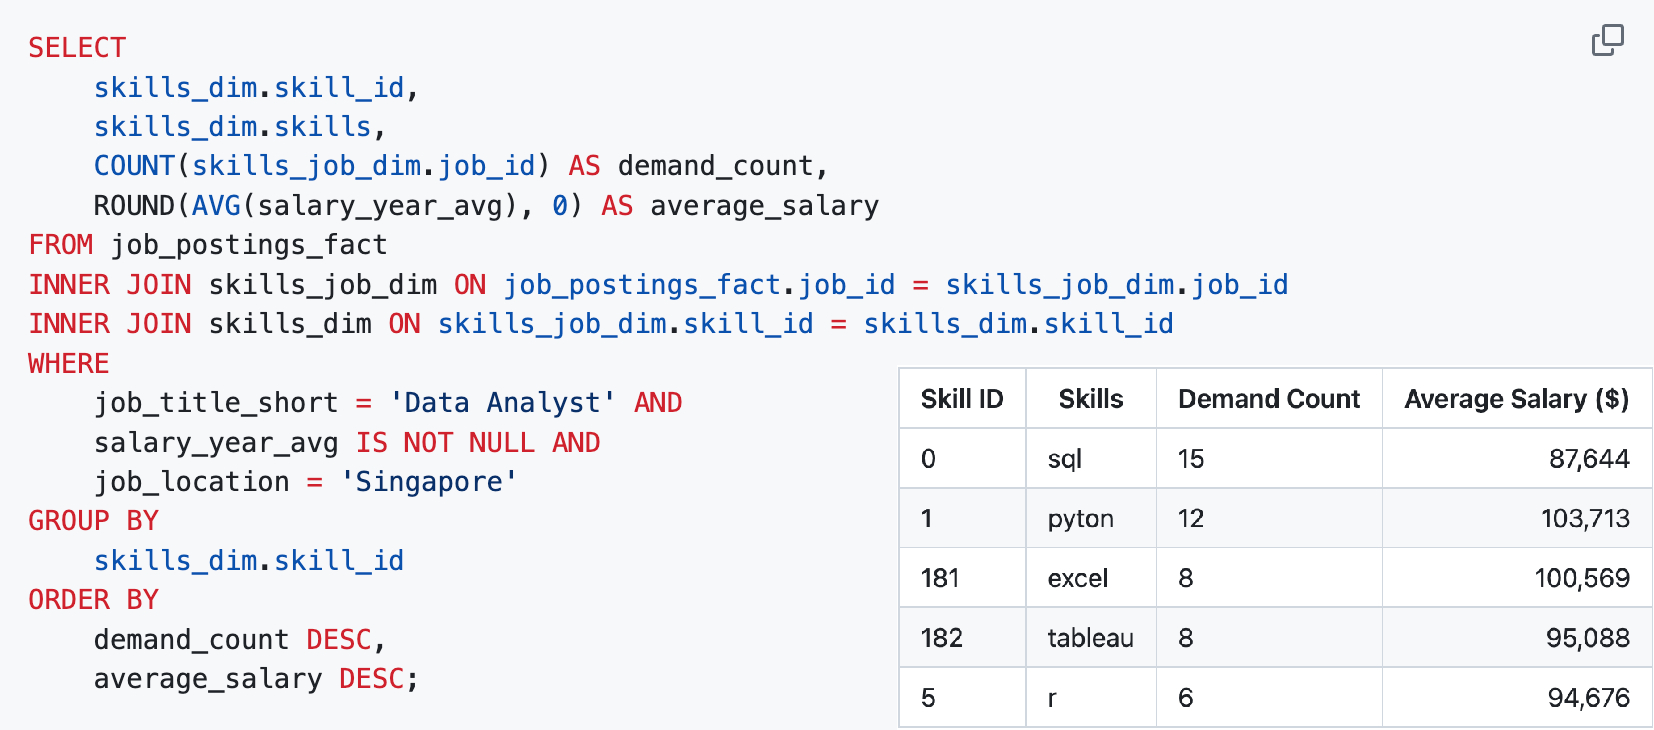
Utilised PostgreSQL to aggregate, transform, and
filter 700,000+ data analytics job postings, uncovering insights
on top-paying jobs, in-demand skills, and optimal skills for job
search in Singapore.
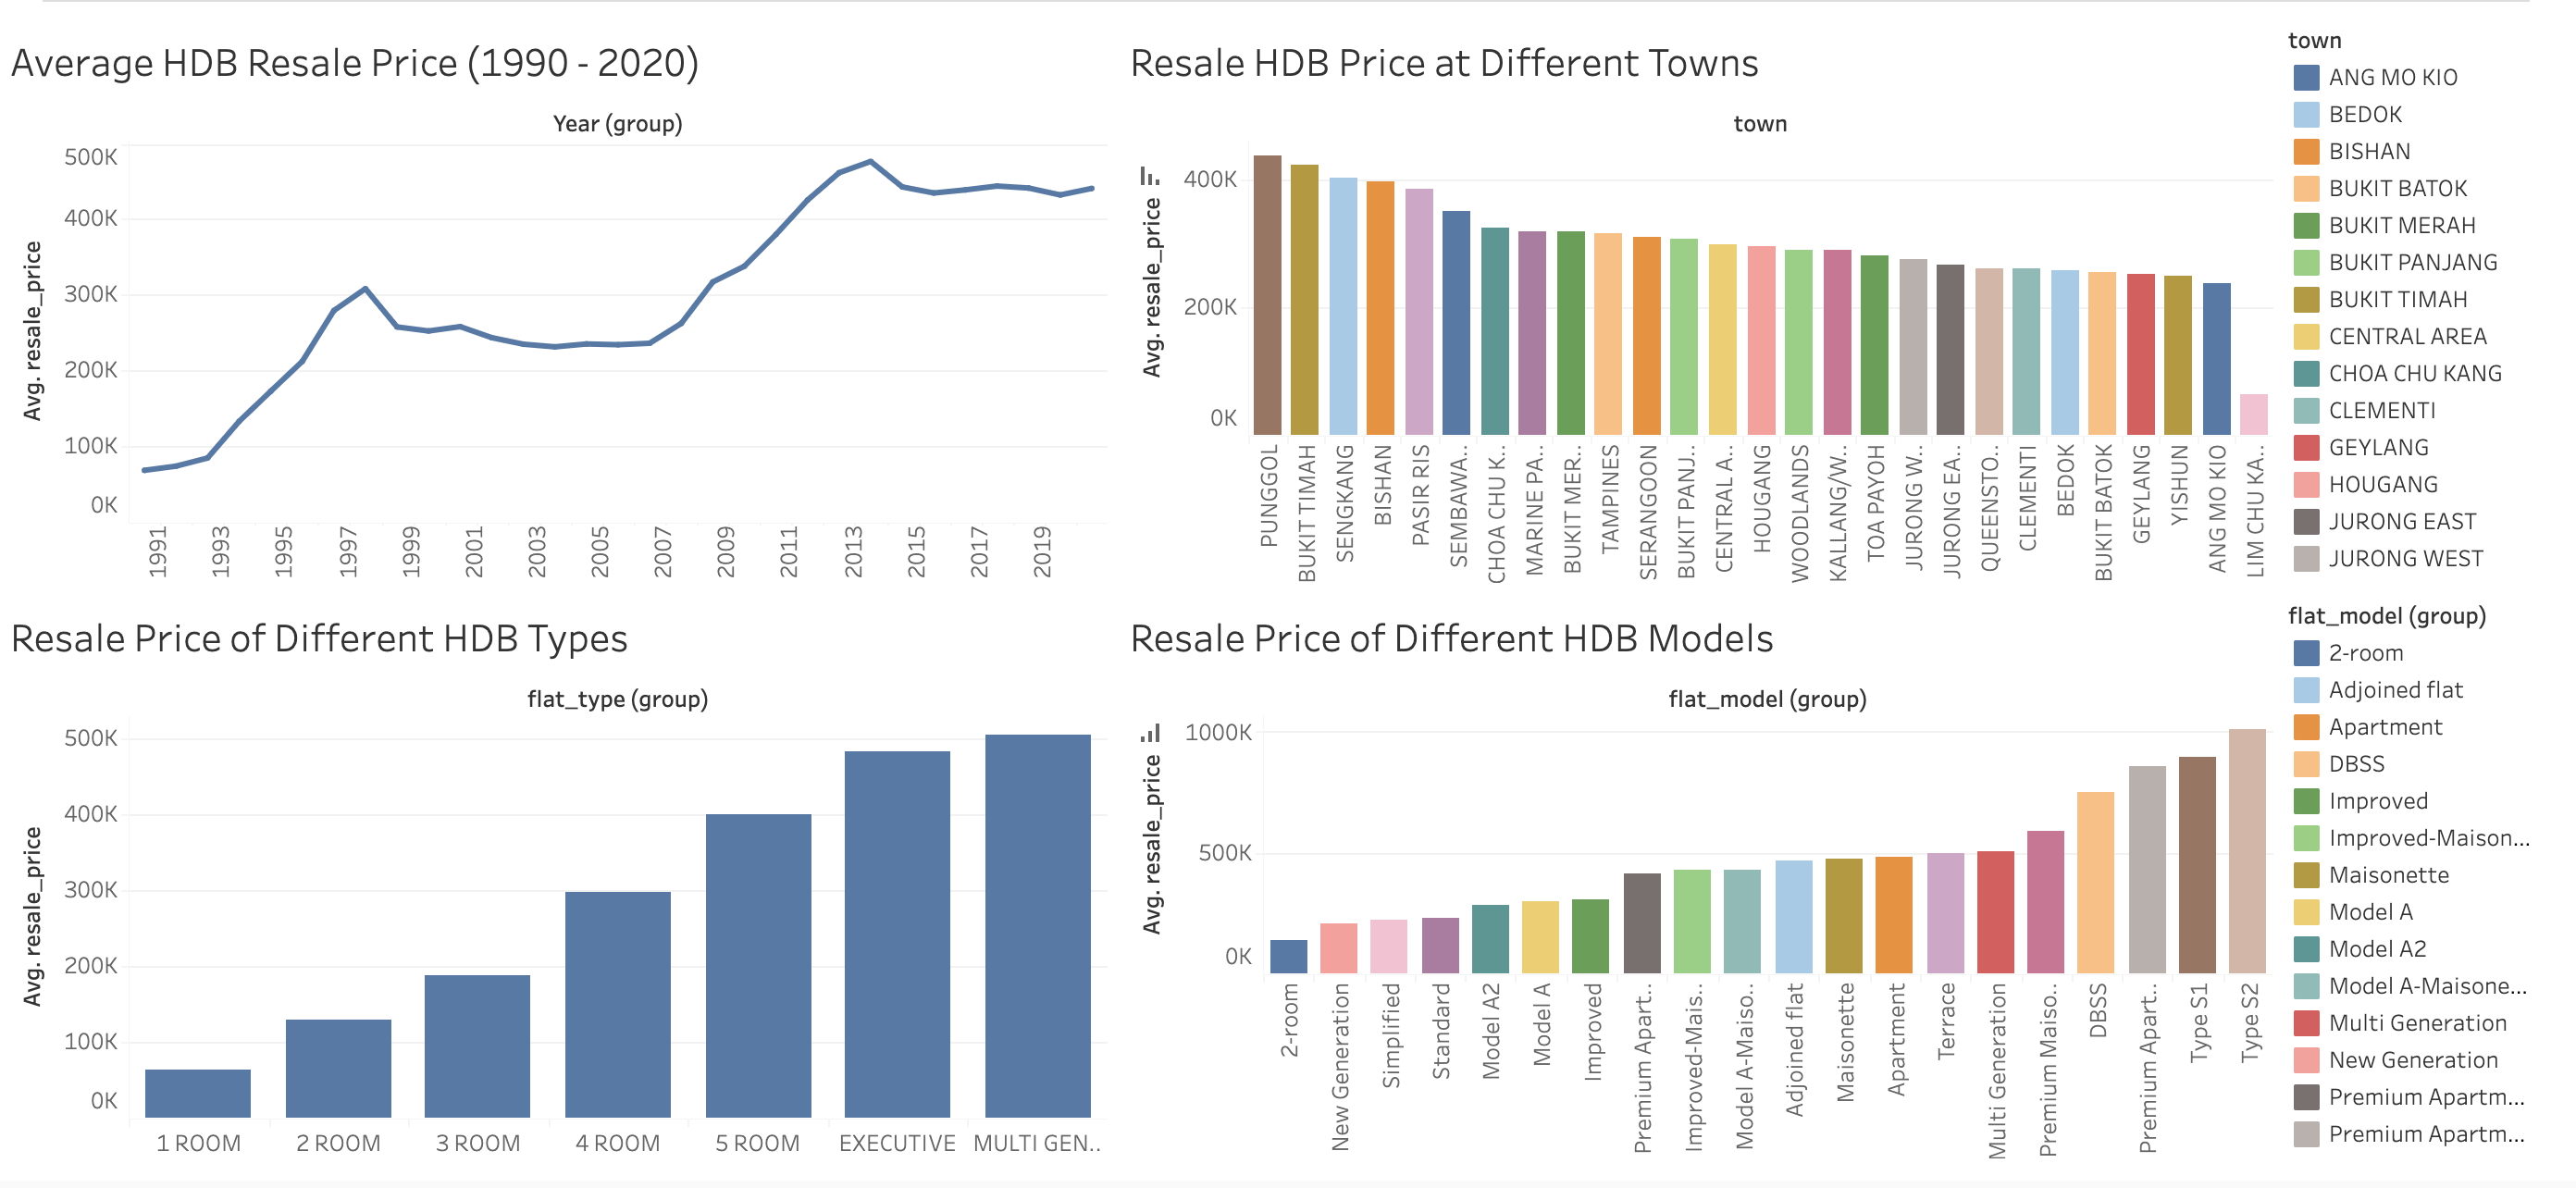
Created a dashboard with Tableau to uncover
insights for Singaporeans who are looking to purchase a resale
flat by analysing the resale prices of 800,000+ HDB flats from
1990 to 2020.
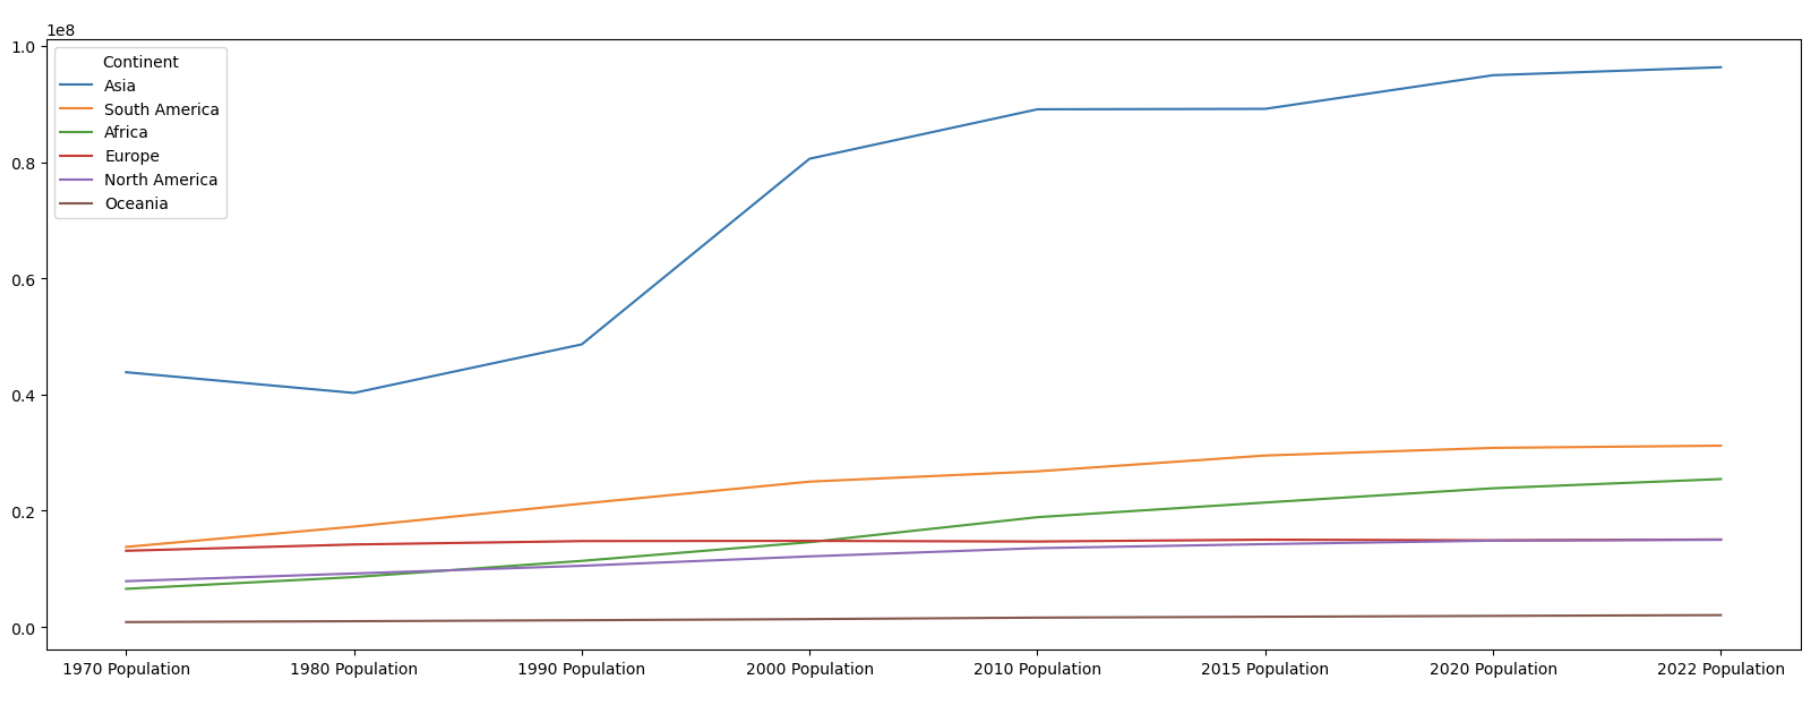
Utilised Python and libraries like
Pandas, Matplotlib, and
Seaborn to analyse and visualise world population
data, gaining insights on growth rate, density, and total
population for each continent and country from 1970 and 2022.
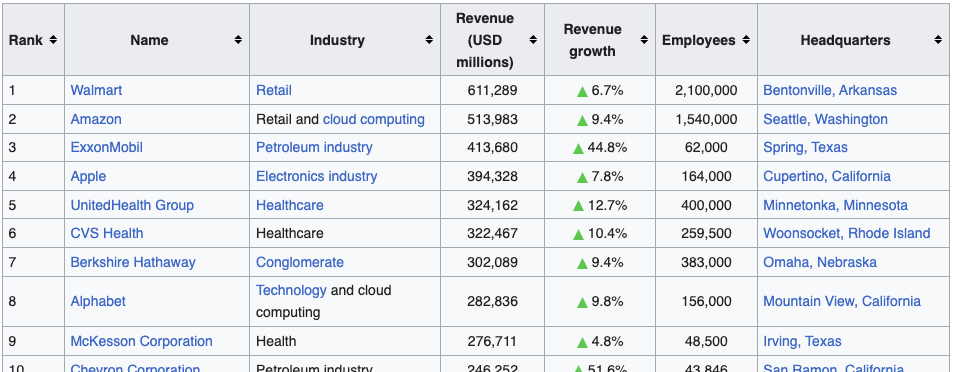
Utilised Python and libraries like
Pandas, BeautifulSoup, and
Requests to scrape the web data of 100 largest
companies by revenue in 2023 before converting it into a CSV file.
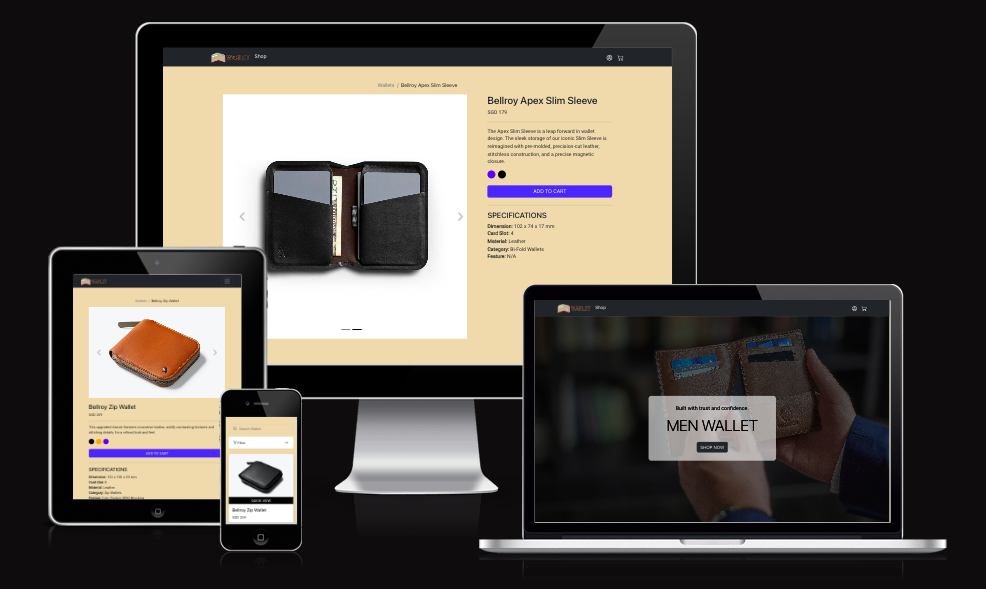
Utilised MySQL for relational database
management, React for frontend web development,
and Express.js, a backend web application
framework for building RESTful APIs with Node.js,
to build an e-commerce wallet shop selling men's wallet.
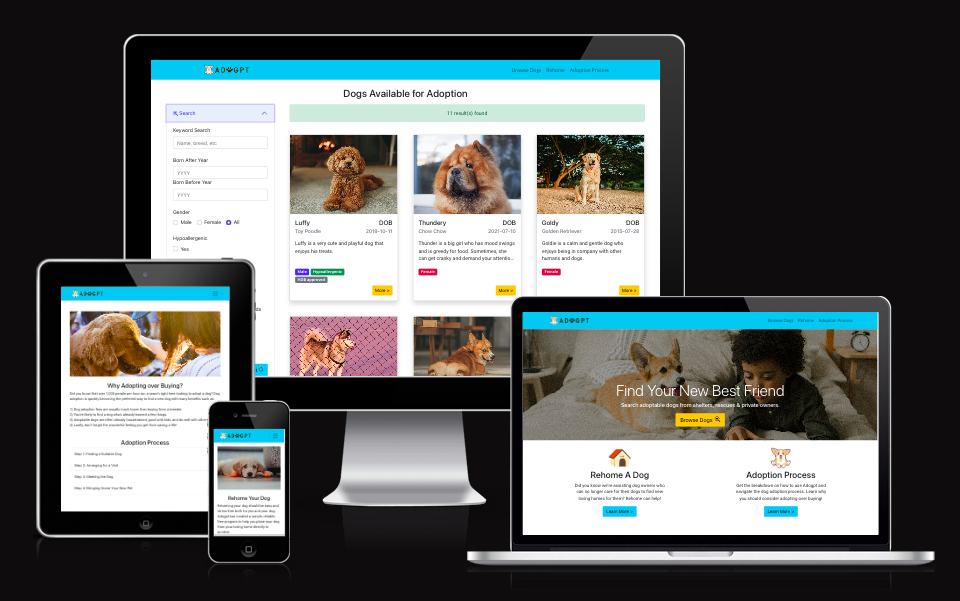
Utilised MongoDB for noSQL database management,
React for frontend web development, and
Express.js, a backend web application framework
for building RESTful APIs with Node.js, to build
a CRUD dog adoption website for current and new dog owners.
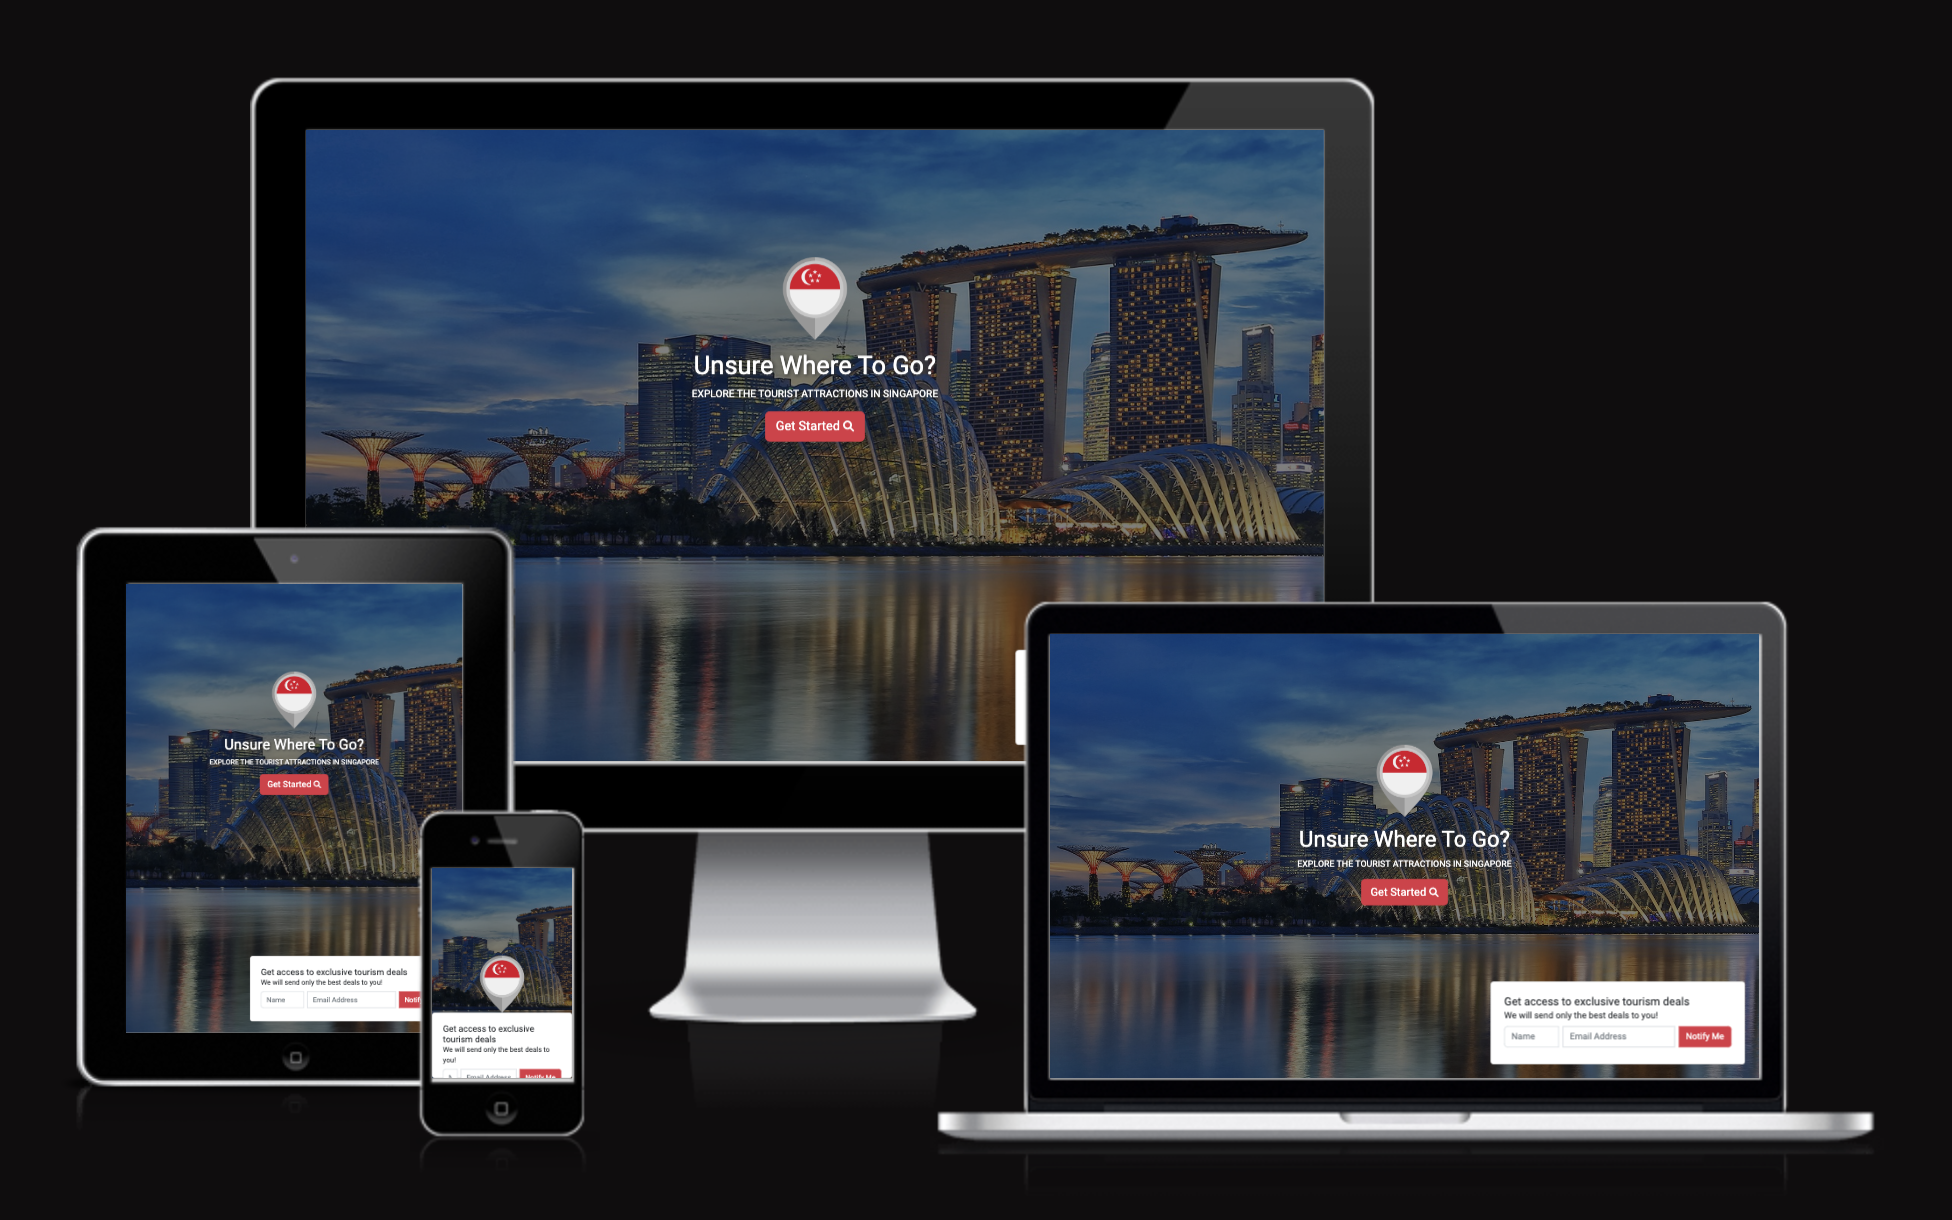
Utilised
HTML, CSS,
JavaScript, Bootstrap, and
Leaflet
to create a mobile-responsive web application with an interactive
map that allows users to explore the different tourist attractions
scattered across Singapore.